Livongo
Data Viz | Defining KPIs
I designed a scorecard to communicate the effectiveness of the diabetes program for enrolled clients, to lead to program renewal and additional program enrollment.
Overview
How it works
Livongo is a digital health company that helps people with chronic conditions live better lives. They sell their programs to a variety of companies whose members enroll in the programs.
Problem
The users (Livongo’s clients) need a way to understand the impact that the diabetes program has on their employees’ lives. They want to track key indicators of the cost effectiveness of the program to help them determine if they will continue to use Livongo. Livongo needs a scalable way to keep these types of clients regularly updated and effectively frame how this data is presented.
Goals
- Short-term: positive customer feedback that the report is useful and easily understood
- Long-term: increases in program renewal rate and additional program enrollment
Solution
I designed a report that helps clients understand how the diabetes program is helping their members by highlighting outcomes. From my user research, I determined which key performance indicators of the program are useful to clients when evaluating Livongo and which are available to be shared with them in light of the constraints around data.
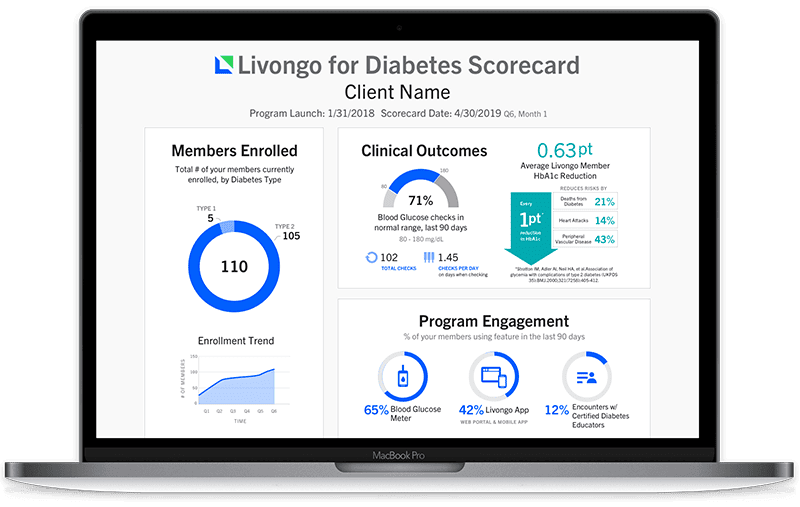
Before (Beta Version)
After
Key changes:
- Clinical Outcomes category
- Illustrated importance of HbA1c reduction, even if it is not client-specific
- Enrollment trend and Diabetes Type numbers
- Eliminated categories that are not useful (NPS, member communications, average BG value, alerts)
How I got there
Start big
My goal was to first identify what’s preferable, before narrowing down to what’s possible in terms of data available to be shared. Livongo had released a beta version of a one-page summary report for SMB clients, but it needed further validation before general release.
What I learned:
- Clients want to know how they are doing in comparison to others
- They want to know what are the goals or targets they should be trying to achieve
- They want to know if people are engaged with the program and if that is an indicator of positive health outcomes
- Is Livongo saving us money?
Explorations
I collaborated with a product manager and a software engineer to understand the constraints in the data and design visuals to fit that.
I explored various ways to present each metric that clearly illustrates what their data means, by giving enough context to the numbers.

Constraints
Some of the data can’t be specific to the client if they don’t meet the minimum threshold of people enrolled, in order to preserve HIPAA compliance. A client must also be enrolled for a certain length of time to see outcomes specific to them. And Livongo was also still determining their own baselines for some of the metrics—what should clients aim for?
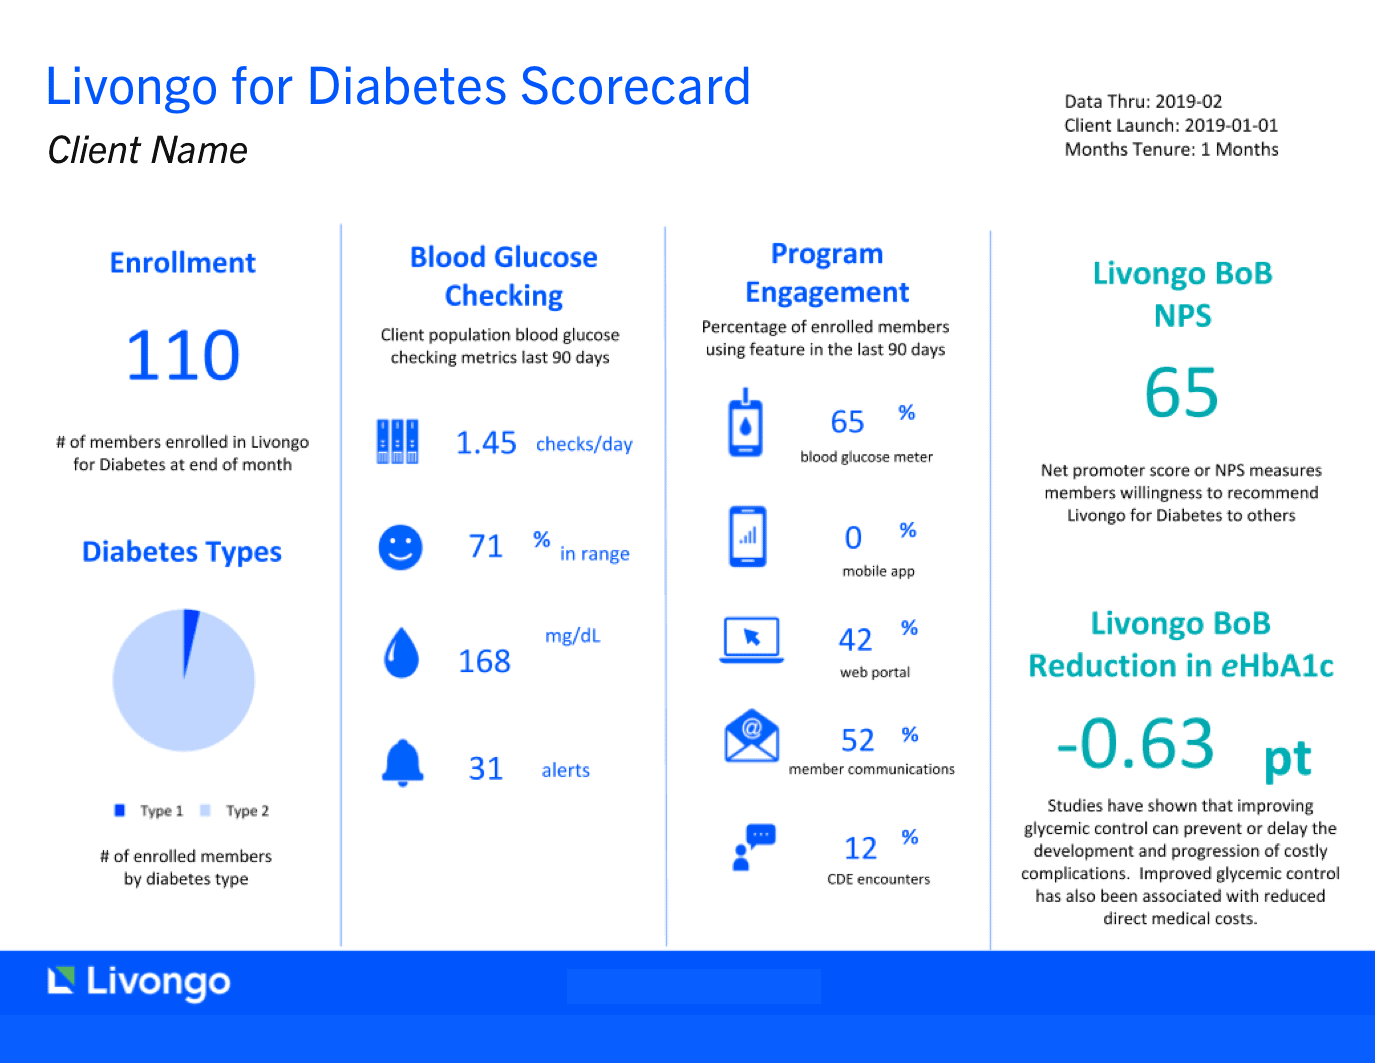
Exploration 1
Goal: Clients don’t want to pay for something people aren’t using!
- Emphasize enrollment numbers, as that sets the stage for how other metrics are seen
- Draw a strong comparison for Encounters with diabetes educators to show what’s good or bad
Feedback:
- Can’t show Livongo’s overall enrollment number in the enrollment trend, or their CDE encounters number to draw comparisons
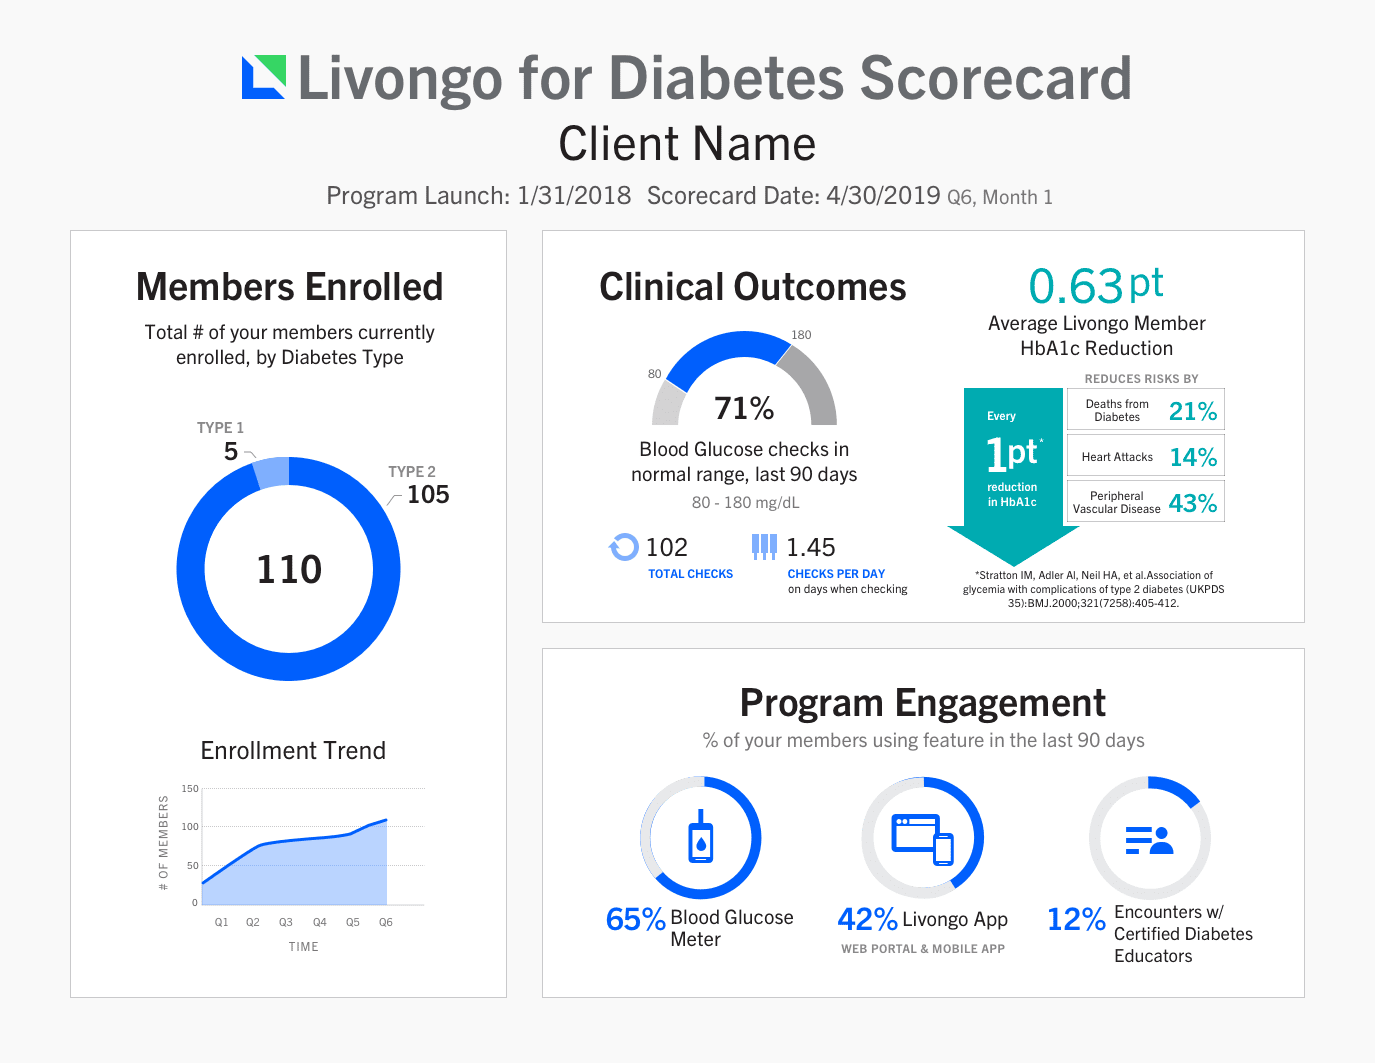
Goal: How are people managing their condition?
- Illustrate HbA1c reduction to emphasize the impact of a small number
Feedback:
- HbA1c looks like it’s specific for the client, when that is an average value
- Effectiveness as a heading can impact the program negatively if the numbers are low
Exploration 2
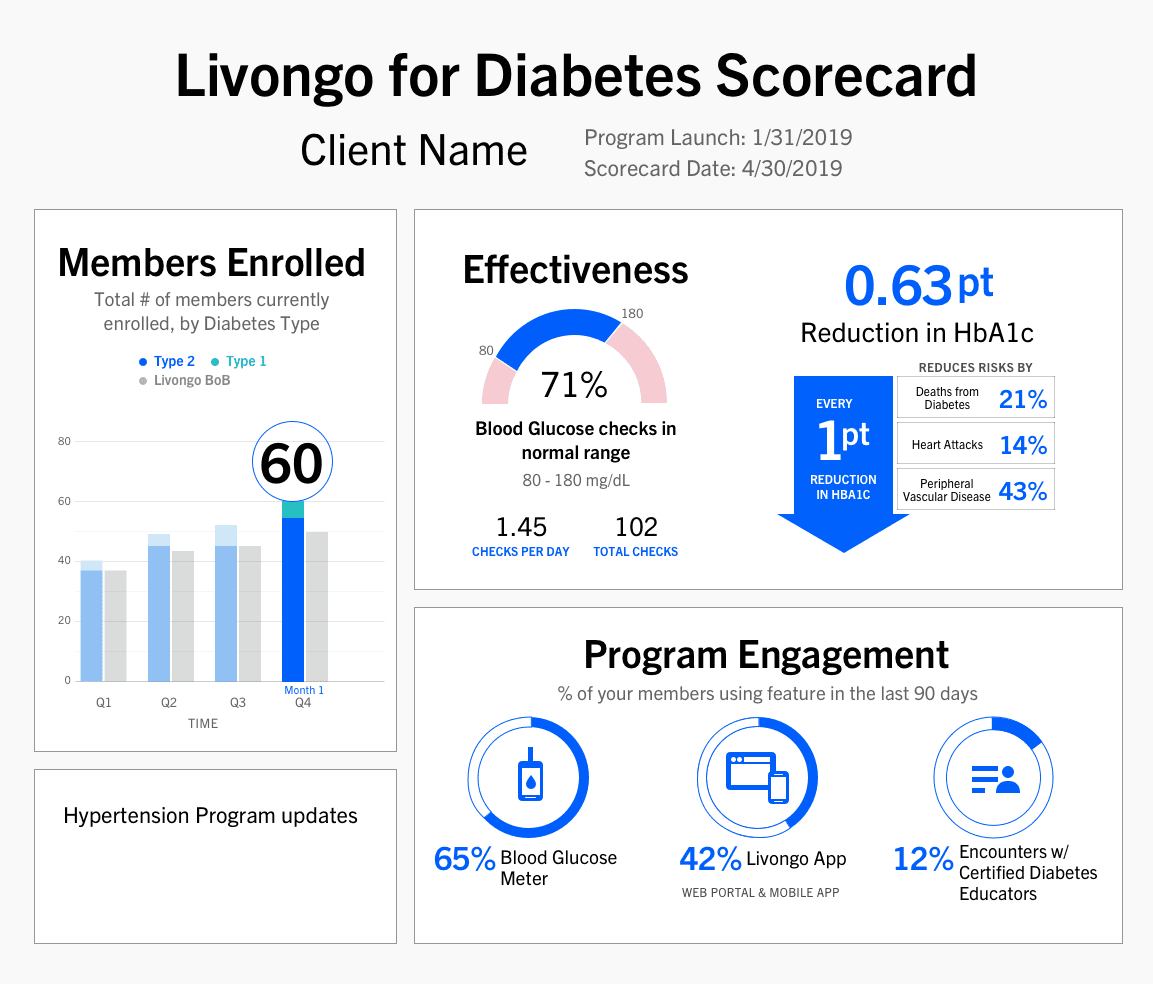
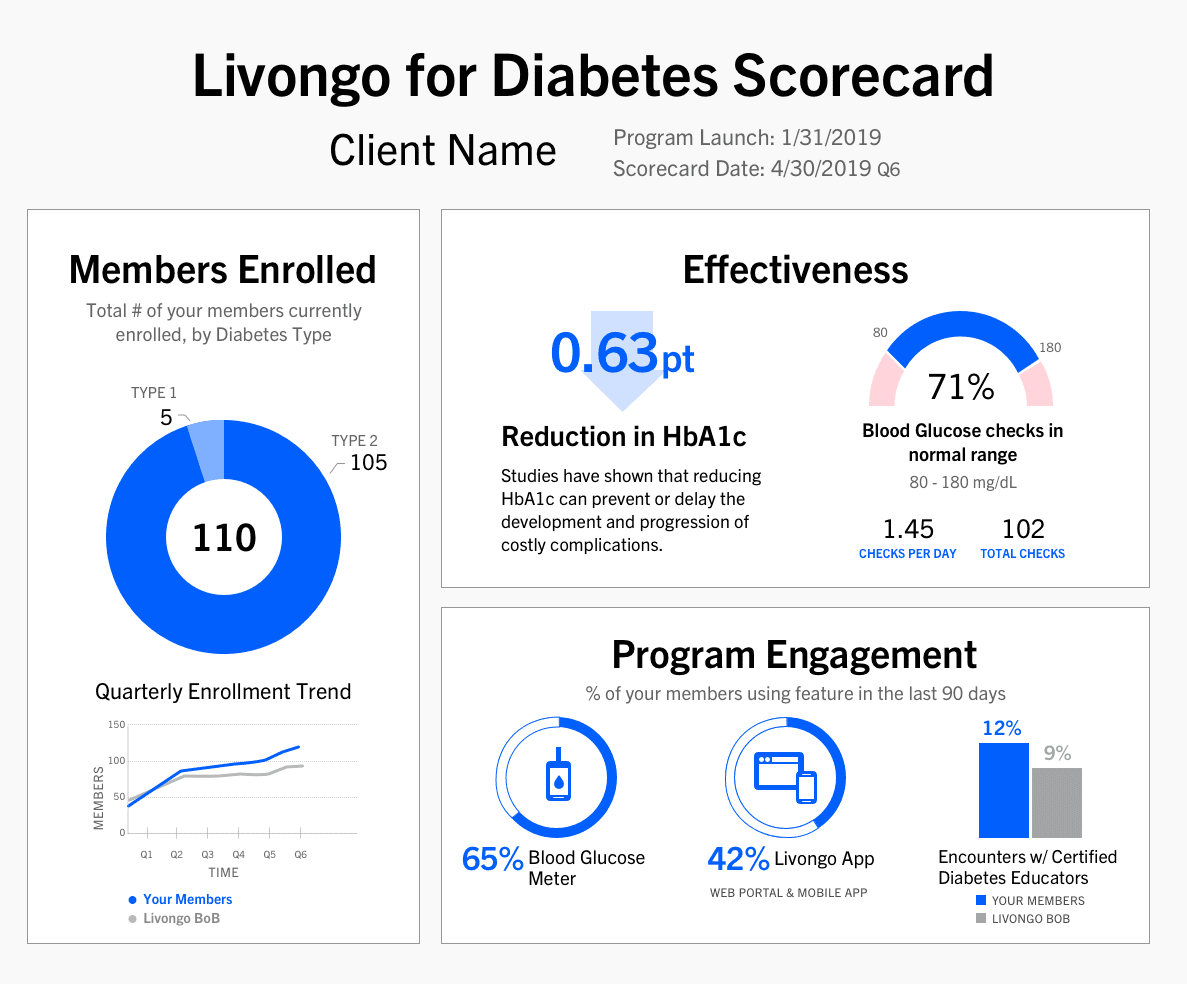
Final Design
This design answers the question “Is Livongo saving us money?” by emphasizing the Clinical Outcomes achieved in the program, but also working within the constraints that HbA1c numbers won’t be client-specific until a certain length of time in the program. HbA1c is distinguished through color from the rest of the scorecard to show that it is an average value. Adding the client’s own enrollment trend will help them stay subscribed, motivated, and engaged with the program. The trend line also works within the constraint that we can’t show how they compare with other clients or overall.
Data Definitions Page

Iconography
Results
Working in tandem with the client development team made this really easy as we moved from one iteration to the next. The design is currently being implemented and feedback is being gathered from clients.
Key Learnings
The initial scope of this project quickly expanded once we realized the wide variety of perspectives across clients in different lifecycles of the product, as well as internal stakeholders across different teams. Clients who are enrolled in multiple programs with Livongo also opened up a new set of questions as we thought through their needs for a scorecard. I decided to combat these issues by breaking up this project into stages, testing and iterating on each stage in order to get feedback and results more quickly. Scorecards for other programs and multiple programs are currently on the roadmap for 2019.